Page 209 - E-BOOK
P. 209

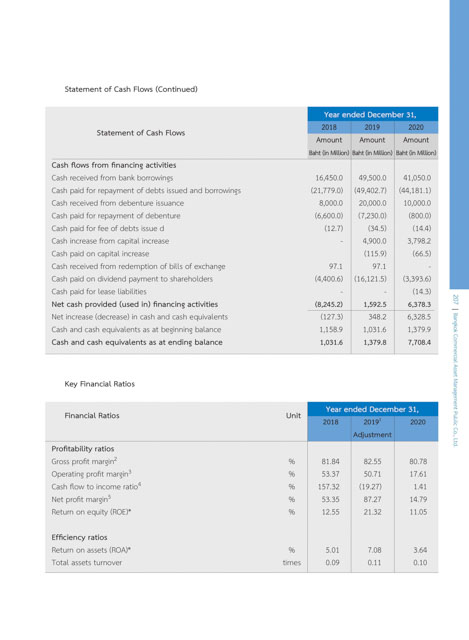
Statement of Cash Flows (Continued)


                                                                                      Year ended December 31,
                          Statement of Cash Flows                                 2018       2019       2020
                                                                                 Amount     Amount     Amount
                                                                               Baht (in Million) Baht (in Million)  Baht (in Million)
              Cash flows from financing activities
              Cash received from bank borrowings                                 16,450.0   49,500.0   41,050.0
              Cash paid for repayment of debts issued and borrowings            (21,779.0) (49,402.7)  (44,181.1)
              Cash received from debenture issuance                               8,000.0   20,000.0   10,000.0
              Cash paid for repayment of debenture                               (6,600.0)   (7,230.0)   (800.0)
              Cash paid for fee of debts issue d                                   (12.7)     (34.5)      (14.4)
              Cash increase from capital increase                                      -     4,900.0    3,798.2
              Cash paid on capital increase                                                  (115.9)      (66.5)
              Cash received from redemption of bills of exchange                    97.1       97.1           -
              Cash paid on dividend payment to shareholders                      (4,400.6) (16,121.5)   (3,393.6)
              Cash paid for lease liabilities                                          -          -       (14.3)
              Net cash provided (used in) financing activities                    (8,245.2)   1,592.5    6,378.3     207
              Net increase (decrease) in cash and cash equivalents                (127.3)     348.2     6,328.5
              Cash and cash equivalents as at beginning balance                   1,158.9    1,031.6    1,379.9
              Cash and cash equivalents as at ending balance                      1,031.6    1,379.8    7,708.4


                Key Financial Ratios                                                                                Bangkok Commercial Asset Management Public Co., Ltd.

                                                                         Unit       Year ended December 31,
                 Financial Ratios
                                                                                   2018      2019 1      2020
                                                                                          Adjustment
              Profitability ratios
              Gross profit margin 2                                        %        81.84     82.55       80.78
              Operating profit margin 3                                    %        53.37     50.71       17.61
              Cash flow to income ratio 4                                  %      157.32     (19.27)       1.41
              Net profit margin 5                                          %        53.35     87.27       14.79
              Return on equity (ROE)*                                     %        12.55     21.32       11.05


              Efficiency ratios
              Return on assets (ROA)*                                     %         5.01      7.08        3.64
              Total assets turnover                                      times      0.09      0.11        0.10
   204   205   206   207   208   209   210   211   212   213   214